Dashboards are essential for operating at scale. They summarize volume, turnaround, agreement, quality results and queues. They cannot fully capture the weak signals that appear in conversations, repeated questions and day-to-day judgment before a pattern becomes statistically obvious.
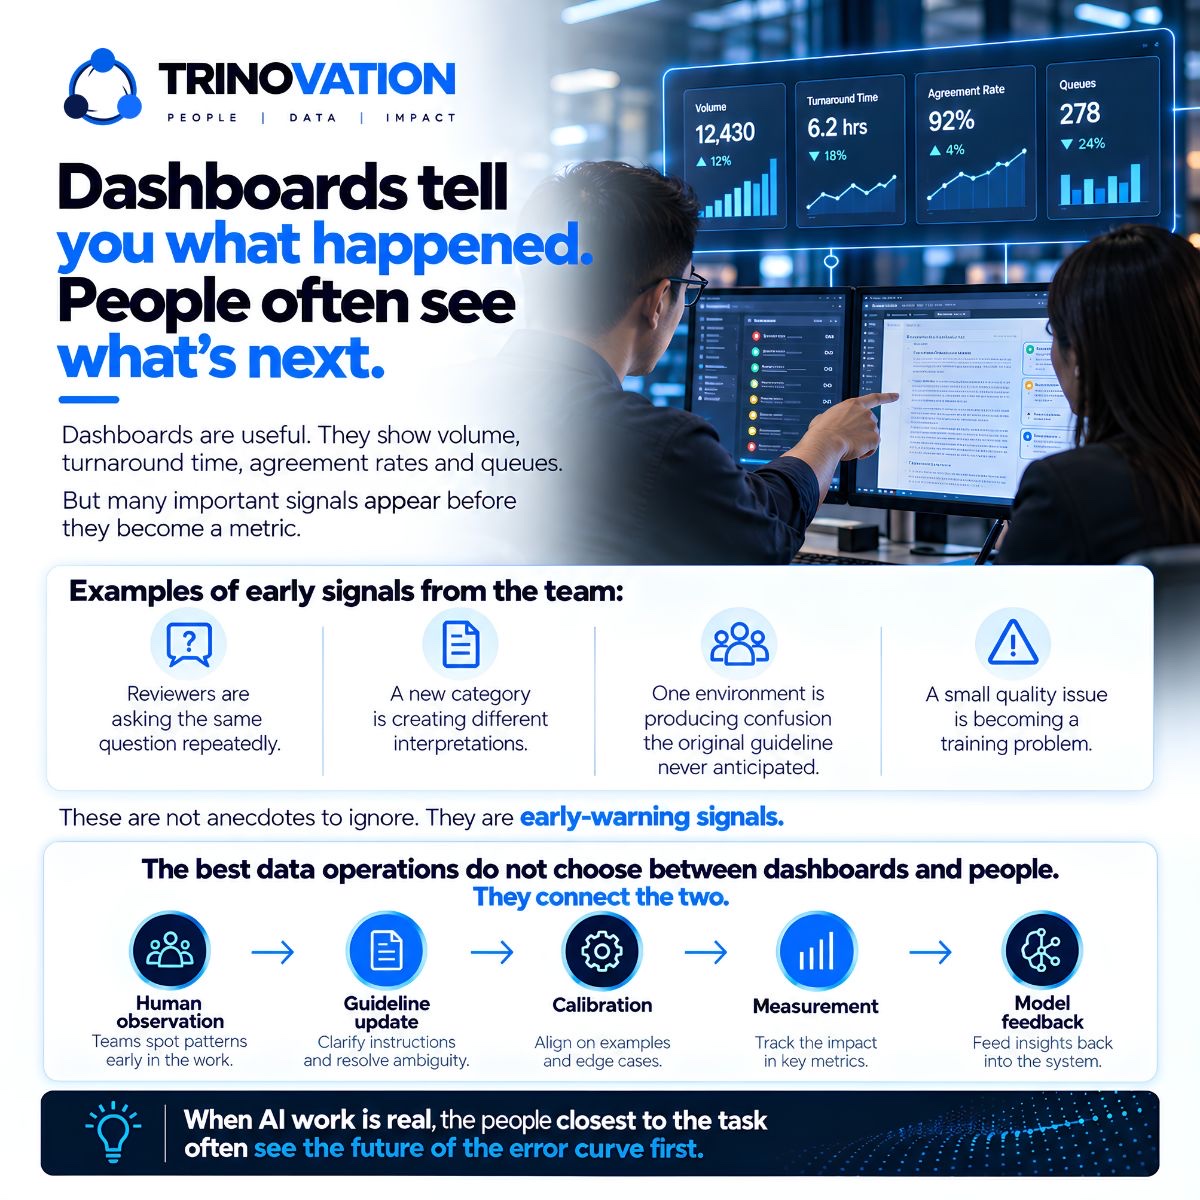
Examples of early signals from the team:
- Reviewers are asking the same question repeatedly.
- A new category is creating different interpretations.
- One environment is producing confusion the original guideline never anticipated.
- A small quality issue is becoming a training problem.
These are not anecdotes to ignore. They are early-warning signals.
The signal appears before the metric
A reviewer asks the same clarification three times. Two experienced people interpret a new category differently. A customer environment produces an unfamiliar kind of uncertainty. A guideline update solves one problem and quietly creates another.
Individually, these observations can look anecdotal. Together, they may be the earliest evidence of a taxonomy, training or product issue. Team leads are well positioned to connect them because they see the work, the people and the change over time.
Why dashboards arrive later
Dashboards depend on defined measures. An emerging problem may not yet have a category, or it may be spread across several existing metrics. Aggregate results can also dilute a small but commercially important failure mode.
This is not a criticism of measurement. It is a reminder that measurement begins with observation and definition. Human signals help the organization decide what needs to be measured next.
Create a path for operational intelligence
Team observations should not remain informal. Build a simple process to record recurring questions, classify the affected workflow and identify whether the response is a clarification, guideline change, calibration example, taxonomy decision or model-feedback item.
The process should be lightweight enough to use and structured enough to analyze. The goal is not to create a second bureaucracy around the dashboard. It is to help important signals enter the quality system before they become expensive.
Close the loop
A useful operating loop looks like this:
- Human observation: teams spot patterns early in the work.
- Documented pattern and an owner decision.
- Guideline or workflow update: clarify instructions and resolve ambiguity.
- Team calibration: align on examples and edge cases.
- Measurement: track the impact in key metrics.
- Model feedback: feed insights back into the system.
Each step creates evidence that the issue was not only discussed but addressed. The team should also hear what happened. Closing the loop builds better judgment because reviewers learn which signals matter and how their observations influence the system.
Combine human and quantitative evidence
The strongest operations do not choose between dashboards and people. They use human observation to discover patterns and quantitative measures to test their size, persistence and effect. Each method corrects the limits of the other.
Ask which operating signal currently reaches leadership too late. Then identify who sees it first, how it is recorded and what decision it should trigger. The answer often reveals a practical opportunity to improve the data operation before the next dashboard review.
Want team leads who surface problems early?
Trinovation's team leads run calibration, escalation and structured feedback to your model team, so issues reach you before they reach the dashboard.
Book a 30-Min Call →Turn team-lead insight into a management system
Give team leads a defined forum to raise patterns with the owners of training, taxonomy, quality and customer communication. The forum should focus on decisions: clarify, investigate, update, measure or escalate. Without a decision path, recurring observations become a list of unresolved anecdotes.
Categorize signals so they can be compared over time. Examples include unclear guidance, missing category, environment shift, tool problem, customer-data inconsistency and training gap. Categories make it easier to distinguish an isolated question from a systemic pattern.
Recognize good escalation behavior. Teams sometimes suppress questions because speed is visible and uncertainty feels like failure. Leadership should make clear that timely escalation protects quality when it is specific, documented and connected to the operating rule.
Questions for the monthly review
Ask which question appeared most often, which issue was discovered by people before it appeared in a metric, which guideline changed and whether the change produced a measurable effect. These questions connect human observation to management evidence.
Also ask which signals are not reaching the right owner. A mature operation improves not only the task workflow but the path information takes through the organization. When team leads can surface and resolve weak signals early, dashboards become more meaningful because the measures reflect what the operation has learned to see.
The leadership habit
During each operational review, invite one signal from the people closest to the work before opening the dashboard. Then use the metrics to investigate whether the signal is isolated, growing or already visible under another measure. This habit keeps qualitative and quantitative evidence connected.
Over time, leaders should track whether earlier signals lead to faster decisions and fewer repeated problems. When the operation learns to recognize important patterns sooner, team-lead judgment becomes measurable through the improvement it enables, even though the original observation began outside the dashboard.
Dashboards and people, connected.
Trinovation deploys domain-trained review teams with team leads, QA workflows, escalation paths and structured feedback to your model team.
Book a 30-Min Scoping Call → See the Free 500-Frame Pilot Download the ChecklistSource and review note: This article is Trinovation's editorial viewpoint. No external statistic or implied internal observation is used.